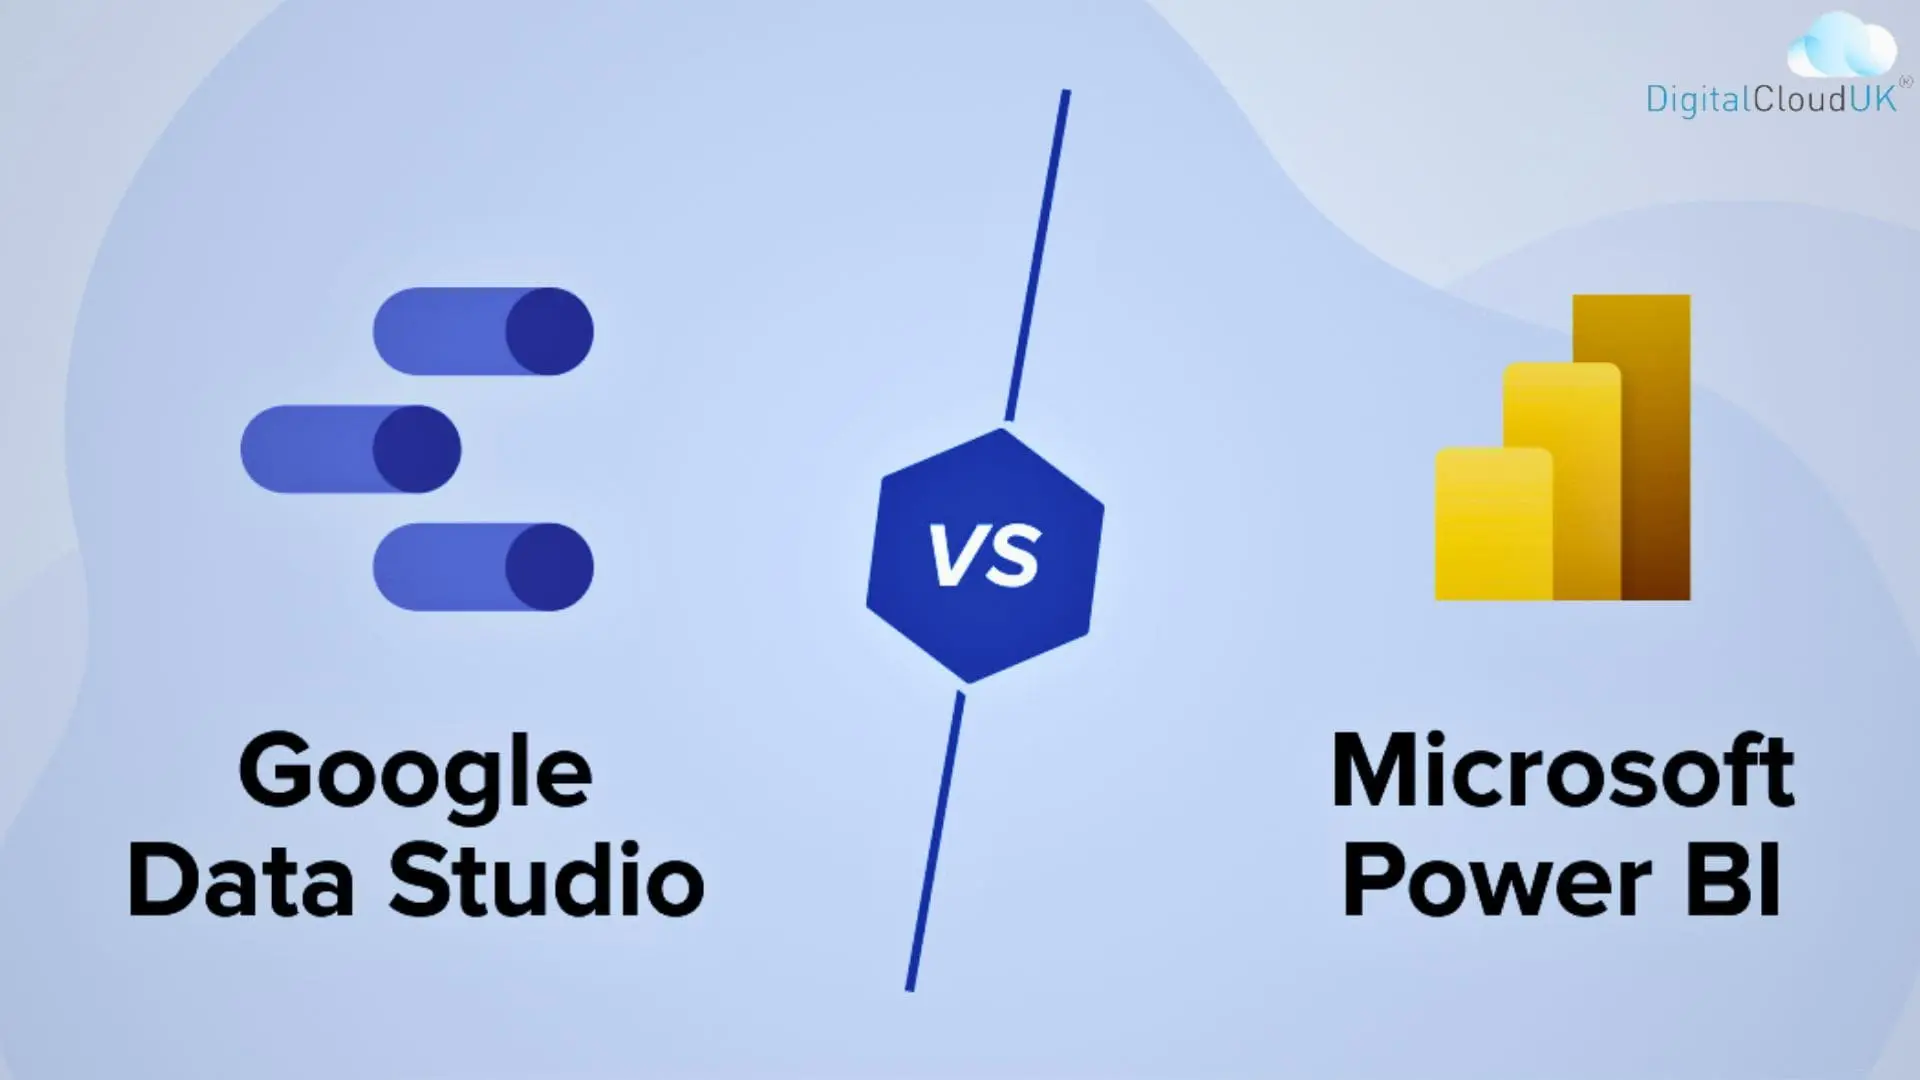
In today’s data-driven world, businesses rely heavily on analytics tools to make informed decisions and gain insights from their information. Two popular choices in the realm of data visualisation and analytics are Google Data Studio and Power BI by Microsoft. Both tools offer powerful features for creating interactive reports and dashboards, but they have their differences in terms of functionality, ease of use, and pricing. In this article, we’ll delve into a detailed comparison of Google Data Studio and Power BI to help you determine which one suits your needs better.
Overview
Google Data Studio:
Google Data Studio is a free business intelligence and information visualisation tool offered by Google. It allows users to create interactive reports and dashboards by connecting to various information sources such as Google Analytics, Sheets, Ads, and more. Google Data Studio is known for its intuitive interface and ease of collaboration, making it a popular choice for marketers and small to medium-sized businesses.
Power BI:
In 2024, Power BI is a powerful business analytics tool developed by Microsoft. It enables users to visualise and share insights from their data through interactive dashboards and reports. Power BI integrates seamlessly with other Microsoft products like Excel, SQL Server, and Azure, providing advanced analytics capabilities. While it offers a free version, it also has subscription-based plans with additional features for enterprise users.
Side by Side Power Bi and Google Data Studio Comparison:
| Feature | Google Data Studio | Power BI |
| Data Sources | Integrates with Google services, databases, CSV files, and third-party sources. | Wide range of data connectors including Microsoft products, cloud services, and third-party applications. |
| Visualisation | Offers a variety of visualisation options, including charts, graphs, and tables. | Rich selection of customisable charts, graphs, and maps. |
| Ease of Use | Intuitive drag-and-drop interface with pre-built templates. | Learning curve for beginners, but comprehensive features for advanced users. |
| Collaboration | Supports real-time collaboration with G Drive, allowing multiple users to edit and view reports simultaneously. | Allows sharing and collaboration with colleagues, version control, and comments. |
| Customisation | Limited customisation options compared to Power BI. | Extensive customisation options with DAX (Data Analysis Expressions) formulas. |
| Price | Free to use with Gmail account. | Free version available; subscription-based plans for additional features. |
Detailed Comparison
-
Data Connectivity:
Google Data Studio offers connectivity to various Google services such as Google Analytics, Ads, Sheets, as well as databases like MySQL, PostgreSQL, and more. Power BI, on the other hand, provides a wide range of connectors including Microsoft products (Excel, SQL Server), cloud services (Azure, Salesforce), and third-party applications (Facebook, SAP).
-
Visualisation Capabilities:
Both tools offer a wide range of visualisation options including charts, graphs, maps, and tables. Power BI, however, provides more advanced visualisation features and customisation options through its DAX formulas, allowing users to create complex calculations and custom visuals.
-
Ease of Use:
In 2024, GDS is known for its easy drag-and-drop interface, making it easy for beginners to create basic reports and dashboards without prior technical knowledge. Power BI has a steeper learning curve but offers more comprehensive features for advanced users, especially those familiar with Microsoft products.
-
Collaboration and Sharing:
Google Data Studio allows real-time collaboration through G Drive, enabling multiple users to edit and view reports simultaneously. Power BI also supports sharing and collaboration with colleagues, along with version control and commenting features.
-
Customisation:
Power BI offers more extensive customisation options compared to the other. With its DAX formulas, users can create complex calculations and manipulate data to suit their specific needs. While GDS provides basic customisation features, it may not be sufficient for users with advanced requirements.
-
Price:
Google Data Studio is free, making it accessible to businesses of all sizes. Power BI also offers a free version with limited features, but subscription-based plans are available for additional functionality and enterprise support.
Pros and Cons
Comparison of the pros and cons of the both:
| Aspect | Google Data Studio | Power BI |
| Pros | Free to use with a Gmail account | Powerful integration with Microsoft ecosystem |
| Intuitive drag-and-drop interface | Extensive range of data connectors and sources | |
| Seamless integration with Google services | Advanced visualisation capabilities with DAX formulas | |
| Real-time collaboration through Google Drive | Robust sharing and collaboration features | |
| Easy to learn, suitable for beginners | Comprehensive features for enterprise users | |
| Simple deployment and setup | Strong community support and resources | |
| Great for small to medium-sized businesses | Flexible pricing options, including a free version | |
| Regular updates and improvements from Microsoft | ||
| Scalable and adaptable to various business needs | ||
| Cons | Limited customisation options compared to Power BI | Learning curve for beginners |
| Fewer data connectors compared to Power BI | Subscription plans can be expensive for large organisations | |
| Relies heavily on Google ecosystem, may not suit all users | Requires familiarity with Microsoft ecosystem for full use | |
| Basic reporting features, may not meet advanced needs | Some features may require technical expertise to implement |
Advantages of Google Data Studio
- Free to for all Gmail users.
- Simple and intuitive drag-and-drop interface.
- Seamless integration with Google services like Google Analytics and Sheets.
- Real-time collaboration through G Drive.
- Easy to learn, making it suitable for beginners.
- Flexible deployment options, including embedding reports on websites.
- Customisable dashboards with a variety of visualisation options.
Disadvantages
- Limited information transformation and modelling capabilities compared to more advanced tools.
- May not support all data sources or require third-party connectors.
- Limited options for advanced analytics and predictive modelling.
- Some users may find the sharing and permission settings confusing.
- Occasional performance issues with large datasets or complex reports.
- Less robust support and community compared to more established BI tools.
Advantages of Power Bi
- Powerful information analysis and visualisation.
- Many data connectors available.
- Strong reporting features.
- Integrates well with Microsoft products.
- Advanced security options.
- Scales for large businesses.
- Regular updates from Microsoft.
Disadvantages of Power Bi
- Can be difficult to learn.
- Requires a subscription.
- Limited visual customisation.
- Interface may not be intuitive for everyone.
- Connecting on-premises information can be complex.
- Costly for large user bases.
Conclusion
Both are powerful tools for data visualisation and analytics, each with its own strengths and weaknesses. Google Data Studio is ideal for small to medium-sized businesses looking for an intuitive and cost-effective solution with seamless integration. On the other hand, Power BI is well-suited for enterprise users and those requiring advanced analytics capabilities and extensive customisation options. Ultimately, the choice between the two depends on your specific requirements, familiarity with the platforms, and budget constraints.


